Analyze and record frequency spectra of power signals
The HAQS system implements a radix-2 based Fast Fourier Transform to produce frequency spectra.
The HAQS system features an interactive LCD touch screen that displays frequency spectra.
HAQS analyses can produce harmonic results up to the 64th harmonic of a 60 Hz power signal.
Frequency spectra of sampled power signals can be viewed down to bins of 15 Hz.
Results can be viewed more closely by tapping the graph,
zooming in and displaying magnitudes at each bin.
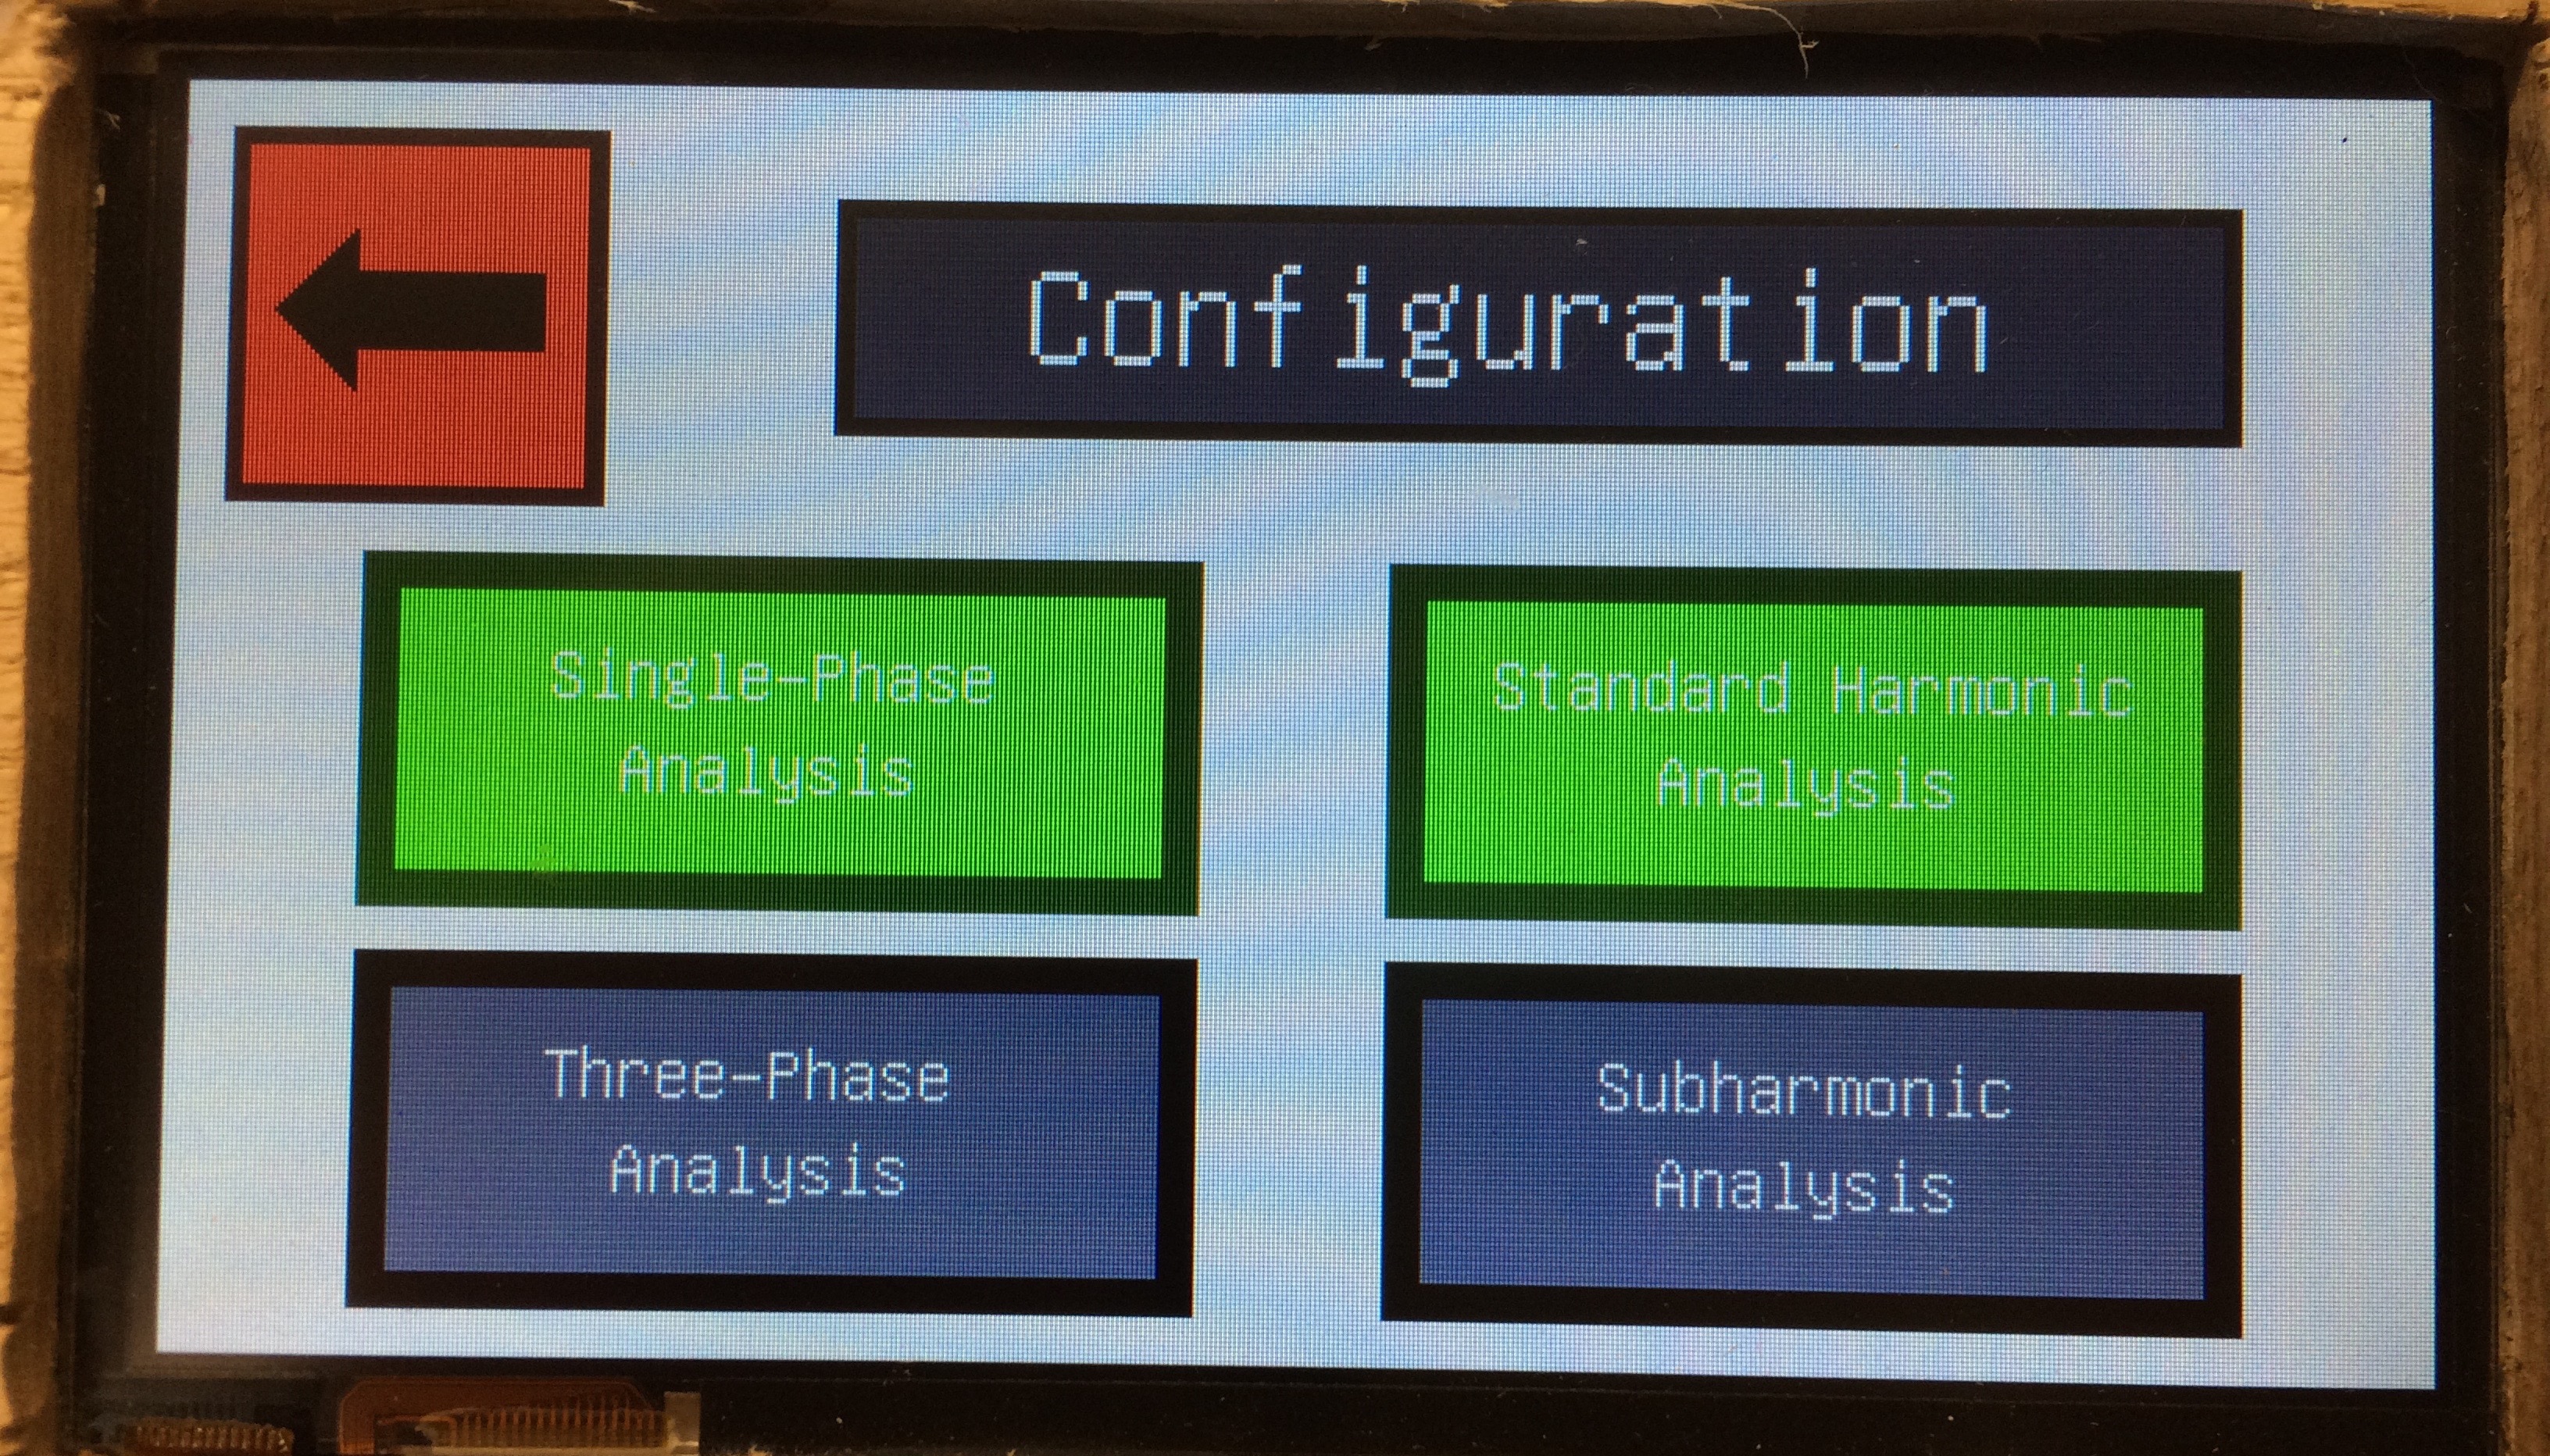
The settings screen allows the user to switch between performing single-phase and three-phase analyses.
The HAQS system can be put in a low-power mode where the LCD screen will not draw power.
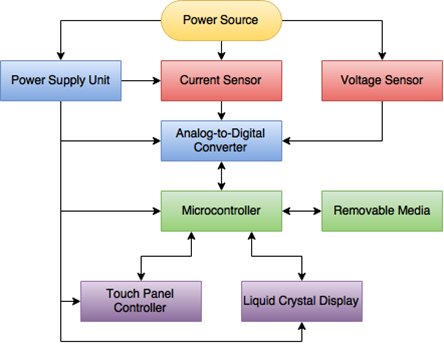
Interactions between components within the HAQS system can be seen in this diagram.
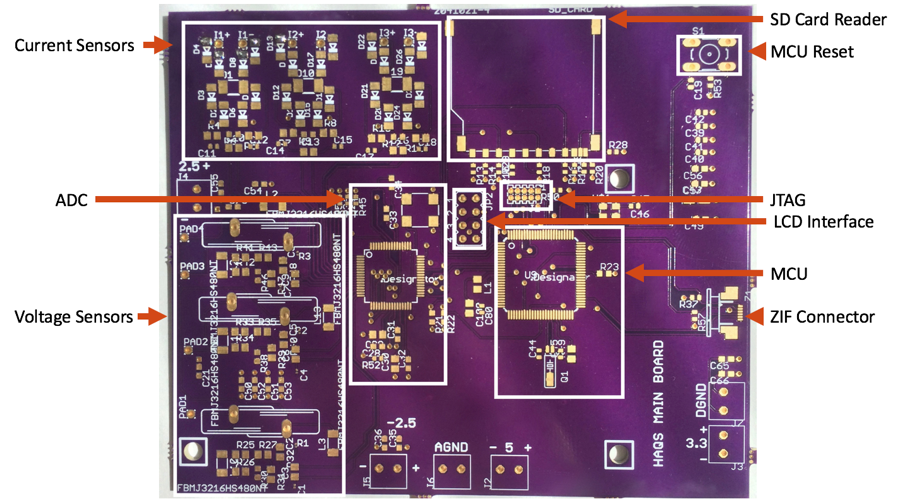
A sensor board was designed, printed and populated to host all peripheral devices within the HAQS system.
The HAQS project was inspired and sponsored by Texas Instruments, who provided several free chips interfaced on the printed circuit boards within the system.